
Market Outlook - Global equities: The great divide
KEY POINTS
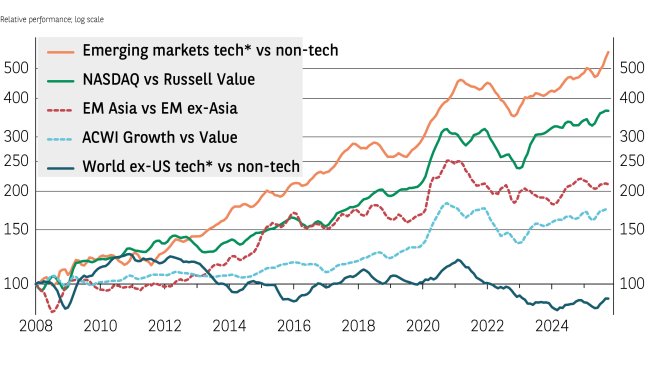
US equity market returns are likely to continue diverging along the lines of technology and the rest of the market: the Nasdaq 100 index delivered a 50% return from the post-Liberation Day lows to the end of October while the Russell 1000 Value index rose by less than half that. That outperformance continues a long-running trend (see Exhibit 1).
We believe technology company earnings can continue to appreciate at a robust, albeit slower, pace next year as the artificial intelligence (AI) revolution continues to drive heavy capital expenditure — and eventually profits across all sectors.
AI’s greatest impact will ultimately be in the other parts of the economy as companies implement the technology to drive earnings growth. This will partly come from reducing labour costs; and the US labour market’s flexibility suggests AI will be integrated more fully, and more quickly, in the US than elsewhere.
The Nasdaq’s strong 2025 gains have been roughly in line with earnings growth, meaning that valuations, while high, have not meaningfully increased. By contrast, the Russell index’s gains have outpaced earnings, leading to an atypically high price-earnings (P/E) multiple (see Exhibit 2).
If AI is indeed a bubble set to burst, valuations will quickly fall, but interest rates should not prompt a downturn like they did in 2022 as the Federal Reserve is looking to lower the policy rate next year instead of increasing it.
A benign way that the index multiple could revert towards its mean would be for the index price to appreciate less than the gain in earnings. With forecasts of 15% earnings growth for the Nasdaq in 2026, there is still room for potentially good investment returns even as multiples compress.
This dynamic of prices rising at a slower rate than earnings would also reduce the high multiple for the US small cap index. The Russell 2000 forward P/E is quite elevated, but earnings growth is also very strong, forecast to advance by over 20% next year.
Given the US’s positive macroeconomic backdrop — deregulation, more mergers and acquisitions activity, rising business investment, wage growth, falling policy rates, and low energy prices — we are optimistic these earnings expectations can mostly be realised.
US small-cap stocks are nonetheless unlikely to sustainably best the S&P 500 due to the weight, and long-term superior performance, of the technology sector. But small caps offer another way to access US economic growth without increasing exposure to the tech sector.
Europe’s autonomy
European corporates have struggled in the face of US tariffs, a stronger euro, and increased Chinese imports. The disruption to the international political and economic order unleashed by the new US administration has spurred Europe to try and reduce its dependence on the US, for example by increasing its capabilities in defence — an initiative called Strategic Autonomy.
Many investors are looking for fiscal stimulus directed to infrastructure and defence to boost corporate profits. Indeed, earnings for the MSCI Europe Aerospace & Defense index are forecast to advance by over 25% next year. We believe this initiative will help the region to offset the US tariff drag and assist the reorientation towards a less export-dependent economic model.
To balance growth exposure in portfolios, investors have the choice of the US Russell 1000 Value index, MSCI Europe or MSCI Japan, which all have a similar sector composition. Expectations for earnings growth are also similar for 2026 at 8%, 12% and 13%, respectively.
While there is little difference in the growth rates, Exhibit 2 shows there is a significant gap in valuations. Both US value stocks and Japan have P/E ratios well above average, while Europe seems to offer the best value.
Exhibit 2: Forward price-earnings ratio z-scores
| Market | United States | Japan* | Russell Value | Developed Markets | US Small Cap | NASDAQ | EM Broad Tech** | EM ex-Broad Tech | Europe |
|---|---|---|---|---|---|---|---|---|---|
| P/E | 1.6 | 1.5 | 1.5 | 1.4 | 1.2 | 0.5 | 0.5 | 0.3 | 0.2 |
Data as at 11 November 2025. *Calculated from 2010; for all other indices calculated from inception.
** Technology, Broadline Retail, Interactive Media & Services. Sources: IBES, Bloomberg, BNP Paribas Asset Management.
Emerging markets potential
Low US Treasury yields, and a weaker US dollar, are typically positive factors for emerging market equities. Export-oriented countries, however, may struggle compared to those that can rely on a large, growing domestic market to generate profits.
As in the US, however, it is primarily the technology sector which is generating superior returns within emerging markets. As Exhibit 1 illustrates, the sector has outperformed the rest of the market by an even greater degree than the Nasdaq has outperformed the Russell Value index.
Of the three countries with the largest technology sectors — South Korea, Taiwan, and China — the latter offers greater diversity than the semiconductor-focused markets of Taiwan and South Korea. We believe China’s technology sector has the additional advantage of being somewhat protected from the current trade tensions between the US and China. Technology companies derive a greater share of their revenues from services rather than goods and so are less affected by tariffs. Given the size of China’s domestic market, its high level of engineering talent (for example, the developers of DeepSeek), and desire to develop its own technological ecosystem, we believe technology companies can generate meaningful future profit growth, despite the challenges facing the domestic economy.
| “The tech sector has been generating superior returns in emerging markets.” |


Disclaimer
Comunicazione di marketing: Prima dell’investimento in qualsiasi fondo gestito o promosso da AXA Investment Managers o dalle società ad essa affiliate, si prega di consultare il Prospetto e il Documento contenente le informazioni chiave per gli investitori (KID). Tali documenti, che descrivono anche i diritti degli investitori, possono essere consultati - per i fondi commercializzati in Italia - in qualsiasi momento, gratuitamente, sul sito internet www.axa-im.it e possono essere ottenuti gratuitamente, su richiesta, presso la sede di AXA Investment Managers. Il Prospetto è disponibile in lingua italiana e in lingua inglese. Il KID è disponibile nella lingua ufficiale locale del paese di distribuzione. Maggiori informazioni sulla politica dei reclami di AXA IM sono al seguente link: https://www.axa-im.it/avvertenze-legali/gestione-reclami. La sintesi dei diritti dell'investitore in inglese è disponibile sul sito web di AXA IM https://www.axa-im.com/important-information/summary-investor-rights.
I contenuti pubblicati nel presente sito internet hanno finalità informativa e non vanno intesi come ricerca in materia di investimenti o analisi su strumenti finanziari ai sensi della Direttiva MiFID II (2014/65/UE), raccomandazione, offerta o sollecitazione all’acquisto, alla sottoscrizione o alla vendita di strumenti finanziari o alla partecipazione a strategie commerciali da parte di AXA Investment Managers o di società ad essa affiliate, né la raccomandazione di una specifica strategia d'investimento o una raccomandazione personalizzata all'acquisto o alla vendita di titoli. L’investimento in qualsiasi fondo gestito o promosso da AXA Investment Managers o dalle società ad essa affiliate è accettato soltanto se proveniente da investitori che siano in possesso dei requisiti richiesti ai sensi del prospetto informativo in vigore e della relativa documentazione di offerta.
Il presente sito contiene informazioni parziali e le stime, le previsioni e i pareri qui espressi possono essere interpretati soggettivamente. Le informazioni fornite all’interno del presente sito non tengono conto degli obiettivi d’investimento individuali, della situazione finanziaria o di particolari bisogni del singolo utente. Qualsiasi opinione espressa nel presente sito internet non è una dichiarazione di fatto e non costituisce una consulenza di investimento. Le previsioni, le proiezioni o gli obiettivi sono solo indicativi e non sono garantiti in alcun modo. I rendimenti passati non sono indicativi di quelli futuri. Il valore degli investimenti e il reddito da essi derivante possono variare, sia in aumento che in diminuzione, e gli investitori potrebbero non recuperare l’importo originariamente investito.
Ancorché AXA Investment Managers impieghi ogni ragionevole sforzo per far sì che le informazioni contenute nel presente sito internet siano aggiornate ed accurate alla data di pubblicazione, non viene rilasciata alcuna garanzia in ordine all’accuratezza, affidabilità o completezza delle informazioni ivi fornite. AXA Investment Managers declina espressamente ogni responsabilità in ordine ad eventuali perdite derivanti, direttamente od indirettamente, dall’utilizzo, in qualsiasi forma e per qualsiasi finalità, delle informazioni e dei dati presenti sul sito.
AXA Investment Managers non è responsabile dell’accuratezza dei contenuti di altri siti internet eventualmente collegati a questo sito. L’esistenza di un collegamento ad un altro sito non implica approvazione da parte di AXA Investment Managers delle informazioni ivi fornite. Il contenuto del presente sito, ivi inclusi i dati, le informazioni, i grafici, i documenti, le immagini, i loghi e il nome del dominio, è di proprietà esclusiva di AXA Investment Managers e, salvo diversa specificazione, è coperto da copyright e protetto da ogni altra regolamentazione inerente alla proprietà intellettuale. In nessun caso è consentita la copia, riproduzione o diffusione delle informazioni contenute nel presente sito.
AXA Investment Managers può decidere di porre fine alle disposizioni adottate per la commercializzazione dei suoi organismi di investimento collettivo in conformità a quanto previsto dall'articolo 93 bis della direttiva 2009/65/CE.
AXA Investment Managers si riserva il diritto di aggiornare o rivedere il contenuto del presente sito internet senza preavviso.
A cura di AXA IM Paris – Sede Secondaria Italiana, Corso di Porta Romana, 68 - 20122 - Milano, sito internet www.axa-im.it.
© 2025 AXA Investment Managers. Tutti i diritti riservati.